
|
MzMatch/mzMatch.R: an open source software for the sequential processing and analysis of mass spectrometry data -- A tutorial
In this tutorial a customizable pipeline for mass spectra calibration, processing, filtering, annotation, statistical analysis and visualization is presented. The benefits of such a processing pipeline include an easy "rewind" option to roll back to intermediate steps in the data analysis and increased verifiability of the performance of the analytical methods. The developed approaches have provided us with a better understanding of the information content of our observations and a better assessment of the metabolites detected in the analyzed data sets.
A working example of the generic mzMatch processing pipeline is given, applying the software to an LC/MS data set.
| File structure and data processing setup |
|---|
Establishing an easy-to-use and maintainable file structure is key when processing any large data sets. All data files should be stored on the local hard drive and not on shared network drives or remote file systems.
Nineteen data files recorded on an Orbitrap Exactive mass spectrometer coupled to an HPLC chromatography system will be used in this tutorial. Data files were kindly provided by the Unit of Molecular Parasitology of the Institute of Tropical Medicine, Antwerp, Belgium (Dr. Maya Berg and Dr. Manu Vanaerschot).
To access this data set you can use following commands in R; we assume that you have a read/write access to your "D:" drive(on machine running Microsoft Windows). If not, you will have to alter the file paths accordingly.
setwd ("D:/")
download.file("http://puma.ibls.gla.ac.uk/datafiles/tutorial_data.zip",
   destfile="tutorial_data.zip")
unzip ("tutorial_data.zip")
file.remove ("tutorial_data.zip")
In case the direct download link does not work or access to a Web resources from R is restricted by a proxy server you can download the data set used in this tutorial from here . After downloading the file "tutorial_data.zip", uncompress the file and follow the further steps of this tutorial.
In either case, the folder "tutorial_data" will be created. It contains the subfolder "mzXML", where the actual data files converted to the mzXML file format are stored. The file "sample_setup.tsv", formated as tab separated values (TXT), contains information about technical/biological replicates, and defines a type and sample class for each sample. The file should have at least two columns and the first row should contain the labels. The following columns are expected: "filenames" -- a relative path (if files are located in subfolders the file name should start with "./folder\_name") and the full name of the data files. "sampleClass" -- a character string defining a class label for the data files. "globalClass" -- this column is optional and can contain a label to group together different sample sub-classes, for example, analytical samples and quality control (QC) samples.
| filenames | sampleClass | globalClass |
| ./mzXML/Blank.mzXML | Blank | Blank |
| ./mzXML/Class_1A.mzXML | Class_1 | Data |
| ./mzXML/Class_1B.mzXML | Class_1 | Data |
| ./mzXML/Class_2A.mzXML | Class_2 | Data |
| ./mzXML/Class_2B.mzXML | Class_2 | Data |
| ./mzXML/DilS_1A.mzXML | DilS_1 | QC |
| ./mzXML/DilS_1B.mzXML | DilS_1 | QC |
| ./mzXML/DilS_2A.mzXML | DilS_2 | QC |
| ./mzXML/DilS_2B.mzXML | DilS_2 | QC |
| ./mzXML/DilS_4A.mzXML | DilS_4 | QC |
| ./mzXML/DilS_4B.mzXML | DilS_4 | QC |
| ./mzXML/DilS_8A.mzXML | DilS_8 | QC |
| ./mzXML/DilS_8B.mzXML | DilS_8 | QC |
| ./mzXML/STD1_A.mzXML | STD_1 | Standards |
| ./mzXML/STD1_B.mzXML | STD_1 | Standards |
| ./mzXML/STD2_A.mzXML | STD_2 | Standards |
| ./mzXML/STD2_B.mzXML | STD_2 | Standards |
| ./mzXML/STD3_A.mzXML | STD_3 | Standards |
| ./mzXML/STD3_B.mzXML | STD_3 | Standards |
Contents of the "sample_setup.tsv" file for the tutorial data set are shown in table above. The data set contains one "Blank" sample (measurement extraction solvent); this sample/samples can be used to filter out biologically non-relevant signals from the data set. Samples in groups "Class_1" and "Class_2" are 2 biological replicates measured for two different biological conditions. Samples from groups "DilS_1", "DilS_2", "DilS_4" and "DilS\_8" are dilution series samples which will be used to filter out spurious signals as described in Jankevics et. al. Samples "STD_1", "STD_2" and "STD_3" are measurements of mixtures of authentic standards and can be used for metabolite identification in the analytical samples.
Before the mzmatch.R package can be used, it needs to be installed and loaded into the R environment. This can be achieved with the following command:
library(mzmatch.R)
mzmatch.init(version.1=FALSE)
NOTE: This tutorial is based on mzmatch.R 2.0 (the function parameter version.1 is set to FALSE). PeakML files produced with older versions of mzmatch.R will not be compatible with mzmatch.R 2.0. Functions included in version 2 are backward compatible with the syntax of old commands, but some tools mentioned in this tutorial are not supported in versions below 2.0.
After the mzmatch.R library is initialised, we can run a command to set up the data analysis. If the file ``sample\_setup.tsv'' has already been created the following command should be used:
mzmatch.R.Setup(samplelist="sample_setup.tsv")
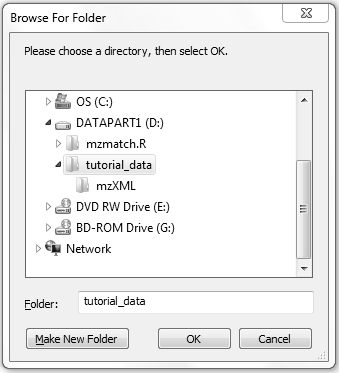
This command will open a graphical window asking the user to navigate to the project folder "D:/tutorial_data" (file "sample_setup.tsv" should be located at the root of this folder). Note that all data files can be stored in one or more sub-folders of this project folder.
 Alternatively, you can specify a "projectFolder" parameter inside the function, indicating a project directory. This parameter is useful if you want to run data processing in the batch mode or on remote servers, where interactive input is not possible.
mzmatch.R.Setup(projectFolder="D:/tutorial_data",
   samplelist="sample_setup.tsv")
Contents of the "sample_setup.tsv" files can be generated also directly within R, calling a function without any parameters.
mzmatch.R.Setup ()
After selecting a data folder from the interactive menu window, all files with extensions mzXML, mzData or mzML present in a given folder and its sub-folders will be listed and the user will be asked to enter "sampleClass" values. After finishing entering all data and clicking on "Quit", the data will be stored and the file "sample_setup.tsv" created in the project folder (if you are using Microsoft Windows just close the editor window to save the data).

| Extracting peaks with centWave algorithm from XCMS |
|---|
The first step in data analysis is feature or peak detection. The command below will use centWave (a highly sensitive features algorithm developed for use with high resolution LC--MS data) algorithm from the XCMS library to extract peaks from raw data files. The parameter "nSlaves" defines how many parallel processes are run simultaneously, so that multiple cores or processors can be used for faster data analysis.
xseto <- xcmsSet(sampleList$filenames, method='centWave', ppm=2,
   peakwidth=c(10,100), snthresh=5, prefilter=c(3,1000),
   integrate=1, mzdiff=0.01, verbose.columns=TRUE,
   fitgauss=FALSE, nSlaves=4)
After XCMS set is created, in the next step we would be exporting the detected signals to the PeakML file format. The command below will create a single file for each measurement, and by default output files are placed in the folder "eakml" within the project directory. 19 files will be created; each of these files can be readily used in the PeakML Viewer.
PeakML.xcms.write.SingleMeasurement(xset=xseto,
	filename=sampleList$outputfilenames, ionisation="detect", ppm=5,
	addscans=0, ApodisationFilter=TRUE, nSlaves=4)
| Combine biological replicates |
|---|
At this step, also called matching, detected signals are aligned between technical or biological replicates of a single sample. This file combination step allows applying different filters (noise filter, RSD filter etc.) on peak data. As replicated samples are expected to be most similar to each other, and any variability in signal intensities is likely to be related to the stability of measurement or sample degradation, such filters are very effective to eliminate irreproducible and noisy peaks from the data sets.
The unit of the "rtwindow" parameter is seconds, and it defines how similar the retention time must be for a peak between different data files for it to be considered as the same signal. The "ppm" parameter is used to set a window of mass deviation in ppm unit. These should be determined by the performance of the instrument that the samples were analysed on.
Output files from the command are written to a folder "combined" in project folder. The folder will contain 10 output files, the number of sample classes defined during the experiment setup step (see table above, column "sampleClass").
mzmatch.ipeak.Combine(sampleList=sampleList, v=T, rtwindow=60,
   combination="set", ppm=5, nSlaves=4)
In this example, the RSD filter, to remove the most variable (i.e. irreproducible) signals between replicates, is applied on the combined data sets. Two folders in the tutorial data directory are created. In the folder "combined_RSD_filtered" data sets of filtered files are written, while in the folder "combined_RSD_rejected" rejected mass chromatograms are written. Note that, for example, we have only one sample in the group "Blank", so that it is not possible to calculate RSD values of the signal intensity for this sample. In this case the RSD filter function will not discard any signals in the given sample.
mzmatch.ipeak.filter.RSDFilter(sampleList=sampleList, rsd=0.3,
   v=T, nSlaves=4)
After removal of spurious and irreproducible signals within replicates of the single samples we can apply a combiner function, to again combine together RSD filtered data files in one final data file. In this way, data from all experimental conditions are grouped together, providing the possibility to compare results and apply further filtering steps on the data set. A single file named "final_combined.peakml" is created.
INPUTDIR <- "combined_RSD_filtered"
FILESf <- dir (INPUTDIR,full.names=TRUE,pattern="\\.peakml$")
mzmatch.ipeak.Combine(i=paste(FILESf,collapse=","), v=T, rtwindow=60,
   o="final_combined.peakml", combination="set", ppm=5)
As was mentioned already above, the PeakML.Viewer software can be used to explore the contents of every generated PeakML file. For example, we can check a peaks in the latest output file.
PeakML.Viewer ()
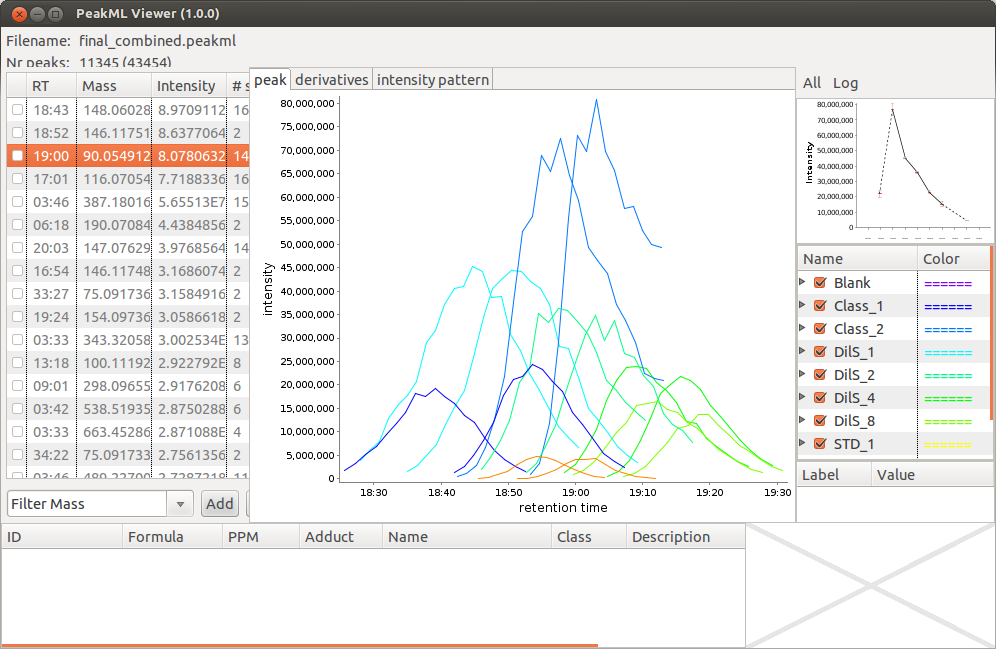
After the PeakML Viewer program is loaded, we can use the "File → Open" menu to open any PeakML file from the project folder. A screenshot from the file "final_combined.peakml" is shown in below. One can see that for mass 90.054912 a significant retention time (RT) drift is present.
 To solve issues related to RT drifts, we can try to apply a correction method provided with the XCMS package. In this example, the Obiwarp method will be applied. We will repeat the same commands as we used in example above, but with slightly different function parameters. The command
 retcor is used to apply RT correction on the XCMS set object created before. Then we change the mzmatch.R setup function call to output Peakml files to a new location (parameter: "outputfolder"), so that a comparison between corrected and uncorrected data is possible. In a similar way we adjust the call for combiner and RSD filter functions. PeakML files for single measurements are created in the "peakml_RTcorr" folder, and combined files of replicates in "combined\_RTcorr", and and RSD filter output in "combined_RTcorr_RSD_filtered". The final combined file will be named "final_RT_corr_combined.peakml".
mzmatch.R.Setup(projectFolder=getwd(), samplelist="sample_setup.tsv",
   outputfolder="peakml_RTcorr")
xset2<-retcor(xseto, method="obiwarp", profStep=0.01, center=3)
PeakML.xcms.write.SingleMeasurement(xset=xset2,
   filename=sampleList$outputfilenames, ionisation="detect", ppm=5,
   addscans=0, ApodisationFilter=TRUE, nSlaves=4)
mzmatch.ipeak.Combine(sampleList=sampleList, v=T, rtwindow=60,
   combination="set", ppm=5, nSlaves=4,outputfolder="combined_RTcorr")
mzmatch.ipeak.filter.RSDFilter(sampleList=sampleList, rsd=0.3, v=T,
   nSlaves=4, inputfolder="combined_RTcorr")
INPUTDIR <- "combined_RTcorr_RSD_filtered"
FILESf <- dir (INPUTDIR,full.names=TRUE,pattern="\\.peakml$")
mzmatch.ipeak.Combine(i=paste(FILESf,collapse=","), v=T, rtwindow=60,
    o="final_RT_corr_combined.peakml", combination="set", ppm=5)
A screen shot showing the same peak set after RT correction is given below, and a considerable improvement in RT alignment can been seen. Although RT drifts are still present, a significant improvement can be observed (compare to figure above). For further analysis we will use the data files after RT correction.
 This filter compares signal intensities between analytical samples and blanks. If peak intensity in blanks is higher or equal to that measured in "real" samples, then these signals are discarded from the data set. The command below will create a file "final_combined_blank_filtered.peakml", and discarded chromatograms will be stored in the file "blank_removed_final_combined_blank_filtered.peakml". The parameter "BlankSample" is used to define which of the sample sets present in the PeakML file should be used as a blank sample.
PeakML.BlankFilter (filename="final_RT_corr_combined.peakml",
   ionisation="detect",
   outputfile="final_combined_blank_filtered.peakml",
   BlankSample="Blank")
It is possible that the combiner incorrectly missed signals, or signals were missed by the peak picking algorithm because of the irregular shape of signals of low intensity. After samples from different conditions are grouped together, it is essential to estimate the background signal intensity level (if a peak was discarded by XCMS because of the peak shape) or if the signal is really absent in the current case. This tool complements missing signals from the raw data files to a combined file produced in the previous step. Also, in Figure above it is clearly shown that highest intense peaks are partially cut at 18 min 50 sec. If the parameter fillAll is set to TRUE, then also signals present in the input file will be re-integrated from the raw data files, using the full RT and mass window of the measured peak set.
PeakML.GapFiller(filename = "final_combined_blank_filtered.peakml",
   ionisation = "detect",
   outputfile = "final_combined_gapfilled.peakml", ppm = 0,
   rtwin = 0, fillAll=TRUE, Rawpath=NULL)
A file named "final_combined_gapfilled.peakml" is created in the tutorial working directory. In figure beloq a data set after application of the gap filling tool is shown. Missing or incomplete peaks have been filled in, especially peak shoulders and low intensity signals (compare to figure above).
 The output of the Gap filler tool generated a file with 10204 peak sets, but some peak sets still do not contain peaks for all 19 samples; this means that in some samples there was no signal detected within the current mass and RT range of these peak sets. Usually, signals detected in only a very small fraction of the all samples contains noise or irrelevant information (this can depend on the type of study, but often the same metabolites are expected to be present in all samples, only at different levels). The following command is retaining only those peak sets which contain peaks from at least 6 samples. The
 mzmatch.ipeak.filter.SimpleFilter function can be also used to filter out signals with intensity lower than some selected threshold, specific mass or RT window or specific annotations. Please refer to the on-line documentation for more details.
A file named "final_combined_ndetect.peakml" is created.
mzmatch.ipeak.filter.SimpleFilter( i="final_combined_gapfilled.peakml",
   o="final_combined_ndetect.peakml", mindetections=6, v=T)
To remove uninformative signals we will also apply a dilution trend filter as described in Jankevics et. al. The parameter trendSets defines sample set names of samples from a dilution series sorted from the most concentrated to the most diluted. All signals that do not correlate with the expected dilution trend (p-value larger than 0.10) will be discarded.
A file named "final_combined_DF.peakml" is created. Discarded peak sets are stored in the file "discarded_final_combined_DF.peakml".
trendSets <- c("DilS_1", "DilS_2", "DilS_4", "DilS_8")
PeakML.DilutionTrendFilter (filename="final_combined_ndetect.peakml",
   ionisation="detect", Rawpath=NULL, trendSets=trendSets,
   p.value.thr=0.10, outputfile="final_combined_DF.peakml")
This tool clusters groups of related peaks (e.g., isotope peaks, adducts, fragments, multiply charged molecules) together and attempts to identify their relationship. Each cluster is given a unique id, which is stored as an annotation with the name relation.id. The relationship is stored as an annotation with the name relation.ship. The possibility is offered only to store the most intense peak of each cluster (option basepeak). This is useful for cleaning up the data before attempting statistical approaches to mine the data. However, as the peak of interest is not per definition the most intense peak one can not rely on this file alone for identification purposes, but needs to apply careful judgment based on the total evidence.
Files named "final_combined_related.peakml" (for the full data set) and "final_combined_basepeaks.peakml" (for base peaks only) are created.
mzmatch.ipeak.sort.RelatedPeaks(i="final_combined_DF.peakml", v=T,
   o="final_combined_related.peakml",
   basepeaks="final_combined_basepeaks.peakml", ppm=5, rtwindow=30)
| Identify peaks from databases |
|---|
This function matches the contents of a given PeakML file with molecular formulas and identities of compounds in various databases. Within the tool chain, in the package mzmatch.ipeak.db, several tools are provided for converting downloadable files (usually from an ftp-server) from the major metabolite databases. When a peak is positively identified, the annotation "identification" is added with the unique database ID corresponding to the match.
Nine example databases are bundled with the mzmatch.R. In the following example, the first command assigns a list of available databases to the R variable DBS. The second command outputs this list of databases on the screen. The third command creates a comma separated character string with database files that we want to use for compound identification. In this example we are using the ESI contaminants database (number 4 in the list), a database of Leishmania donovani parasite metabolites (number 5), and three standard mixture database files (numbers 1 to 3).
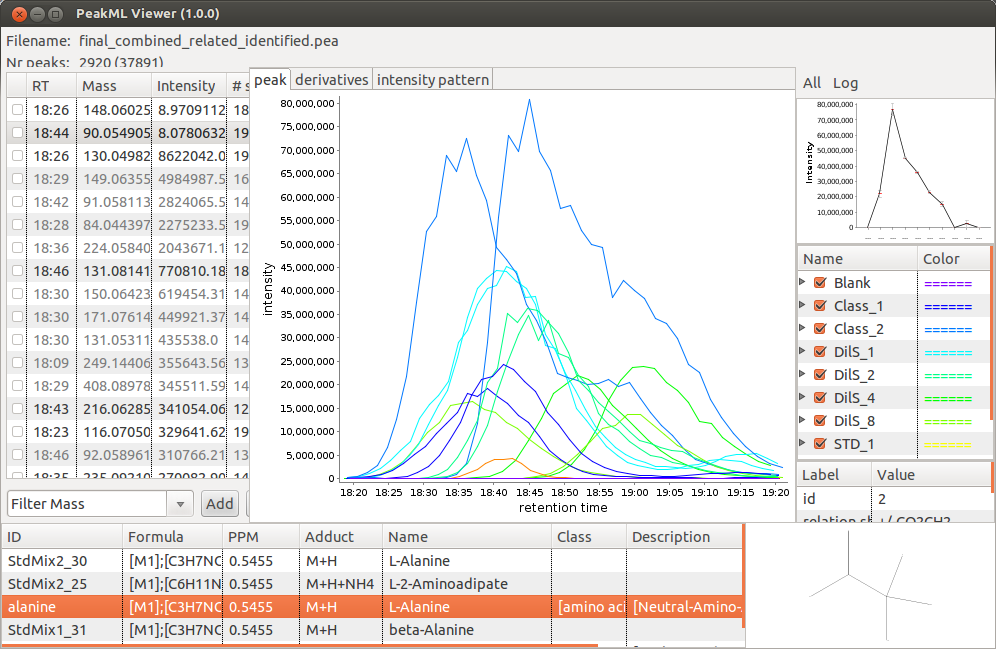
By default, the identification tool will match a measured mass with a compound mass from a data base taking into account that depending on the electrospray source ionisation mode M+H or M-H ions will be detected. The parameter "adducts" can be used to specify a list of additional adducts (mass differences) to consider in the search. In the example below, for positive ionisation mode data we use the following list of adducts: M+H, M+ACN+Na, M+Na, M+K, M+ACN+H. In figure below, the output of the identification tool is shown; all details concerning peak identification are shown in the bottom panel of the PeakML Viewer. Note that, where available, the structural formula of the molecules is also displayed at the bottom right.
Output file named "final_combined_related_identified.peakml" (for complete peak file) is created.
DBS <- dir(paste(.find.package("mzmatch.R"), "/dbs", sep=""),
   full.names=TRUE)
DBS
DBS <- paste(DBS[c(1,2,3,4,5)],collapse=",")
mzmatch.ipeak.util.Identify(i="final_combined_related.peakml", v=T,
   o="final_combined_related_identified.peakml", ppm=5, databases=DBS,
   adducts="M+H,M+ACN+Na,M+Na,M+K,M+ACN+H")
 This function produces a TAB separated TXT file from the final PeakML file produced by the process. The TXT file can be opened in either notepad, Excel, or imported in tools like IDEOM. If opened in Excel, the first column will be the m/z for the peak and the second will be the retention time. The next few columns will contain the intensity information for the compound in each sample, and the final column will contain the putative identification. This allows you to further process the data if you require.
Output file named "final_combined_related_identified.txt" (for complete peak file) is created.
This function produces a TAB separated TXT file from the final PeakML file produced by the process. The TXT file can be opened in either notepad, Excel, or imported in tools like IDEOM. If opened in Excel, the first column will be the m/z for the peak and the second will be the retention time. The next few columns will contain the intensity information for the compound in each sample, and the final column will contain the putative identification. This allows you to further process the data if you require.
Output file named "final_combined_related_identified.txt" (for complete peak file) is created.
mzmatch.ipeak.convert.ConvertToText (
   i="final_combined_related_identified.peakml",
   o= "final_combined_related_identified.txt", databases=DBS,
   annotations="identification,ppm,adduct,relation.ship")
| Plot related peaks clusters |
|---|
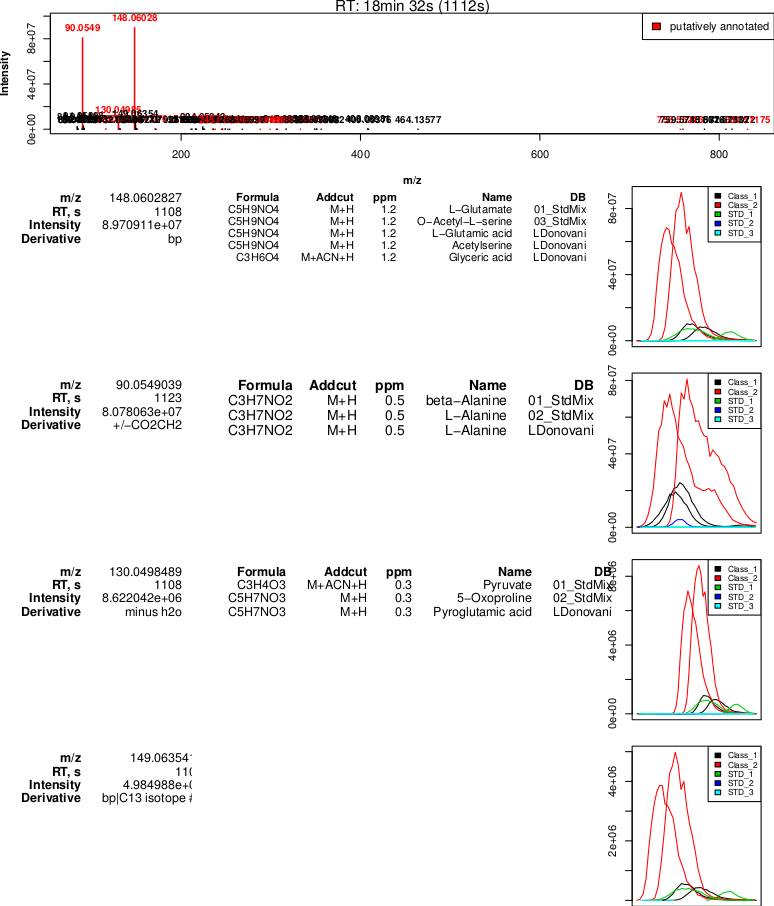
The function below will generate a graphical output in pdf file format. It takes related peaks clusters assigned by the mzmatch.ipeak.sort.RelatedPeaks command and plots an overview, sorted by peak intensity. The fisrt plot of each grouped related peaks set is showing a global mass spectrum, including the average signal intensity across all samples at a specified retention time. Peaks colored in red are signals containing putatively assigned identifications. The following plots show extracted peak chromatograms for each sample, peak mass, retention time, intensity and putatively assigned identifications.
Output file named "Related_peaks_plot.pdf" is created.
PeakML.Plot.RelatedPeaks (
   filename="final_combined_related_identified.peakml",
   ionisation="detect", Rawpath=NULL, DBS=unlist(strsplit(DBS,",")),
  outputfile="Related_peaks_plot.pdf",
   sampleClasses=c("Class_1","Class_2","STD_1","STD_2","STD_3"))
 Output generated by the
 PeakML.Plot.RelatedPeaks command. Two signals with high intensity are putatively identified, and the rest of the signals show much lower intensity. It is most probable that the measured mass 148.06003 can be annotated as L-Glutamine, while the mass 90.05490 is a glutamine fragment that is misidentified as L-Alanine (note that mzMatch identifies this putative relationship between the peaks, indicating the possible loss of CO2CH2). The water loss and first C13 isotope peak are also correctly identified.
One main advantage of mzmatch and the PeakML file format is the possibility to integrate the final or intermediate results with other tools. The examples below will give you a short tutorial on accessing data from R for visualization or statistical purposes.
To read a PeakML data file in the R environment, the PeakML.Read function is used. Output of the function is an R PeakML object, which contains the complete information stored in the original PeakML file, including sample names, extracted chromatograms, sample group names and annotations, peak identifications etc. For more details on function parameters and output structure please refer to the help pages.
PeakMLData <- PeakML.Read("final_combined_related_identified.peakml")
This command creates an R object "PeakMLData". Each measured peak in this object is represented as a chromatogram. Above we gave an example how to export peak intensity information in TXT file format. Although it is possible to read these output files back into the R environment, below we show an example how to get the same structure also directly from a PeakMLData object.
PeakTable <- PeakML.Methods.getCompleteTable (PeakMLData)
The resulting object is a list of three data tables (matrices). The number of rows in each data table is equal to the number of samples, and the number of columns is equal to the number of peak sets (or peak groups) in the PeakML file. The first table contains peak intensities data, the second table masses, and the third retention times.
Such 3-dimensional data for each single sample can be visualised for example as a "bubble plot", where on the x-axis the measured RT is plotted, on the y-axis the mass, and the decimal logarithm of signal intensity determines the size of each "bubble". Such plots are an effective and quick way to evaluate the quality of chromatographic separation and the mass/retention time regions where most of the signals are detected. The example code below will create a pdf file "Bubble_plots.pdf", in which a bubble plot for each sample will be plotted on a single page. The sample names will be used as plot title.
pdf ("Bubble_plots.pdf")
for (snum in 1:length(PeakMLData$phenoData)) \{
   plot (PeakTable$Retentiontimes[snum,], PeakTable$Masses[snum,],
      pch=21, cex=log(PeakTable$Intensities[snum,])/5,
      xlab="RT, s", ylab="Mass")
      title(main=PeakMLData$sampleNames[snum])
\}
dev.off ()
 Example output of the "bubble plot". It can be concluded that large quantity of masses with m/z larger than 400 are eluting at the beginning of the chromatogram. This data set was collected using HILIC chromatography, and it is clearly shown that such setup is not useful to separate lipids and proteins (with masses above m/z 400). A large fraction of small molecules (including also related peaks) are ealuting between 8 and 25 (480 -- 1500 s) minutes of chromatography.
In the next example we will show how to apply a t-test on selected samples from the data. Of course, as there are only 2 samples in each group, one would usually not use a t-test on this dataset, but the same function call would be applied to datasets with a larger number of replicates.
To compare "Class_1" with "Class_2", we need to determine which rows in the data table are matching samples of interest for each sample class:
Example output of the "bubble plot". It can be concluded that large quantity of masses with m/z larger than 400 are eluting at the beginning of the chromatogram. This data set was collected using HILIC chromatography, and it is clearly shown that such setup is not useful to separate lipids and proteins (with masses above m/z 400). A large fraction of small molecules (including also related peaks) are ealuting between 8 and 25 (480 -- 1500 s) minutes of chromatography.
In the next example we will show how to apply a t-test on selected samples from the data. Of course, as there are only 2 samples in each group, one would usually not use a t-test on this dataset, but the same function call would be applied to datasets with a larger number of replicates.
To compare "Class_1" with "Class_2", we need to determine which rows in the data table are matching samples of interest for each sample class:
class1_hits <- which(PeakMLData$phenoData=="Class_1")
class2_hits <- which(PeakMLData$phenoData=="Class_2")
Now we can calculate a t-test for each of the peak sets and store the p-values. Note that if in one or both of the measurements, no signal was detected, then it is not possible to apply a t-test to this peak set. In that case, in the example below, such peak sets will be skipped. After the t-test, the Benjamini and Hochberg method is used to adjust calculated p-values for multiple comparisons.
pvalues <- rep(NA,ncol(PeakTable[[1]]))
for (pval in 1:length(pvalues)) {
   data_class1 <- PeakTable$Intensities[class1_hits,pval]
   data_class2 <- PeakTable$Intensities[class2_hits,pval]
   NA1 <- length(which(is.na(data_class1)))
   NA2 <- length(which(is.na(data_class2)))
   if ( NA1==0 & NA2==0) {
      pvalues[pval] <-t.test(data_class1, data_class2)$p.value
   }
}
adjusted.pval <- p.adjust (pvalues, method="BH")
The resulting p-values can be added as an extra annotation to the "PeakMLData" object and written back to a PeakML file. Afterwards, the resulting file can be opened in the PeakML Viewer, where for example peaks can be selected by setting a p-value threshold.
PeakMLData$GroupAnnotations$p.values.adjusted <- adjusted.pval
PeakML.Write (PeakMLData,outFileName="processed.peakml")
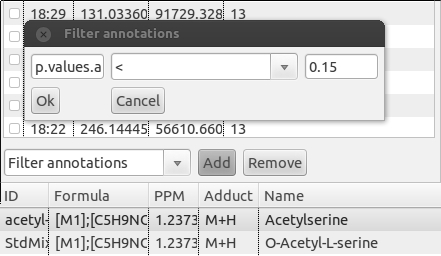
To filter a PeakML file by annotation in PeakML Viewer, locate the drop-down menu on the left side at the bottom of PeakML Viewer program. Select the "Filter annotations" from the list and click the "Add" button. A small configuration window will be opened (figure below). In the first field, enter the annotation name (in our example it is "p.values.adjusted"). In the second field, operators equal (=), larger(>) or smaller(<) should be entered. In the third field a threshold for the value can be set, in the current example we selected 0.15. After pressing the "OK" button, 49 peak set matching these criteria will be displayed in the PeakML Viewer. If you want to filter peaks based on whether an annotation is present for given peak set, then in the first field you should enter the annotation name (for example, "identification") and in the second field the symbol ">", leaving the third field empty and pressing "OK". The PeakML Viewer will show only peak sets containing an "identification" annotation.
 Alternatively, of course, peak sets of interest can be visualised directly within the R environment. For example, to create a pdf file, which contains all peak sets with p-value smaller than 0.15, we first have to select a peak sets matching this criterion, and then construct a plotting command.
matched.peaks <- which(adjusted.pval <= 0.15)
We want to add averaged mass across all samples of the peak set and the p-value from the t-test, as a plot title:
Masses <- apply(PeakTable[[2]], 2, mean, na.rm=TRUE)
titles <- paste ("Mass: ", round(Masses,5), ", p-value: ",
   round(adjusted.pval,3), sep="")
And add putative identifications if those are present for current data set:
DBS <- dir(paste(.find.package("mzmatch.R"), "/dbs", sep=""),
   full.names=TRUE)
DBS <- DBS[c(1,2,3,4,5)]
id.resolved <- PeakML.Methods.DBidToCompoundName(DBS=DBS,
   PeakMLdata=PeakMLData, collapse=FALSE)
Finally we can create a plotting routine; in this case, a pdf file ``pvalues\_plot.pdf'' will be created, each page of the document contains a chromatogram plot of the selected peak set and peak identification information if it is available (Figure \ref{fig:Ch7_Fig10}).
pdf ("pvalues_plot.pdf")
for (peak in matched.peaks) {
   par(mfrow=c(2,1))
   PeakML.Plot.Chromatograms (PeakMLdata=PeakMLData, groupid=peak,
      sampleClasses=c("Class_1","Class_2"), xaxis=TRUE,
      Title=titles[peak], mar=c(2,2,2,2))
   textplot(id.resolved[[peak]], halign="left", valign="top",
      mar=c(1,1,1,1))
}
dev.off ()
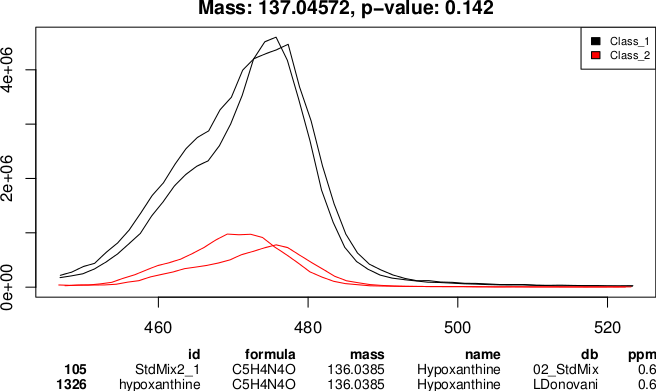 An example output of the
 PeakML.Plot.Chromatograms function used to generate a visual report on selected peak sets.
All commands shown in this tutorial can be used as a single R script, and the complete example script can be located in the tutorial data set and is called "Tutorial.R". When first learning to use R and mzMatch to analyze your data, the main point is to realize that each step in the script happens successively and creates a new file. This means that if you insert a new function somewhere in your processing, you must make sure that the function that occurs after this one is looking for the right input file. The functions used to process the data have been selected to produce a set of results that should accurately show the metabolites detected within the set parameters. This is a basic set up that uses fairly strict filters to produce an initial data set for the user to evaluate. The parameters can be changed in the script and this will alter the output of the processing.
To run the whole script open it via the file menu in R. Now run this script via the edit menu, "Edit → Run all" or you can use the source command from the R console.
|